5G Forecasting Calculation Methods and Use Cases


Forecasting is one of the essential functions to foresee Traffic and User Behavior; thus, we can assess the network load. Based on the forecasting results, we can arrange several initiative-taking actions to handle the anticipated increase in the network load.
Why do we need Forecasting, and what are the common Use Cases?
- Calculate the expected increase to be used as input for the Capacity evaluation and preparation for future projects.
- Calculate PRB Utilization Growth Per/For Cell/Network, which can be used as input to Proactively identify future network bottlenecks and locate the development areas/cells. (New Area with High Traffic Potential). This can be used by the Radio Optimization team or the solution sales team while preparing the network requirements for the coming years.
- Calculate 4G & 5G Traffic Share and Growth factor, which you might need as a guide to Identifying the right timing for reframing or extra investment in the 4G/5G network.
Let`s assume that the customer requested to prepare the Network requirements and scope for the next two years; in this case, then you will need to calculate the traffic expected to increase and load increase to be able to identify the network bottlenecks in terms of load and prepare part of the reframing plan, capacity solutions or new sites based on the results.
What are the Forecasting Calculation Methods?
In general, there are 3 different forecasting methods which all rely on historical data; Microsoft Excel can generate all these methods.
(1) Forecasting Excel Formulas
LINEAR, Exponential Smoothing algorithm and Based on Manual calculation( Growth Factor)
(2) Direct Forecast Sheet( Direct Method from Excel)
This method uses only the ETS function(Exponential Smoothing algorithm)
(3) Chart Forecasting( Trend forecasting)
Based on Linear Forecasting
Forecasting Guides:
Method 1: Forecasting based on Excel Formulas
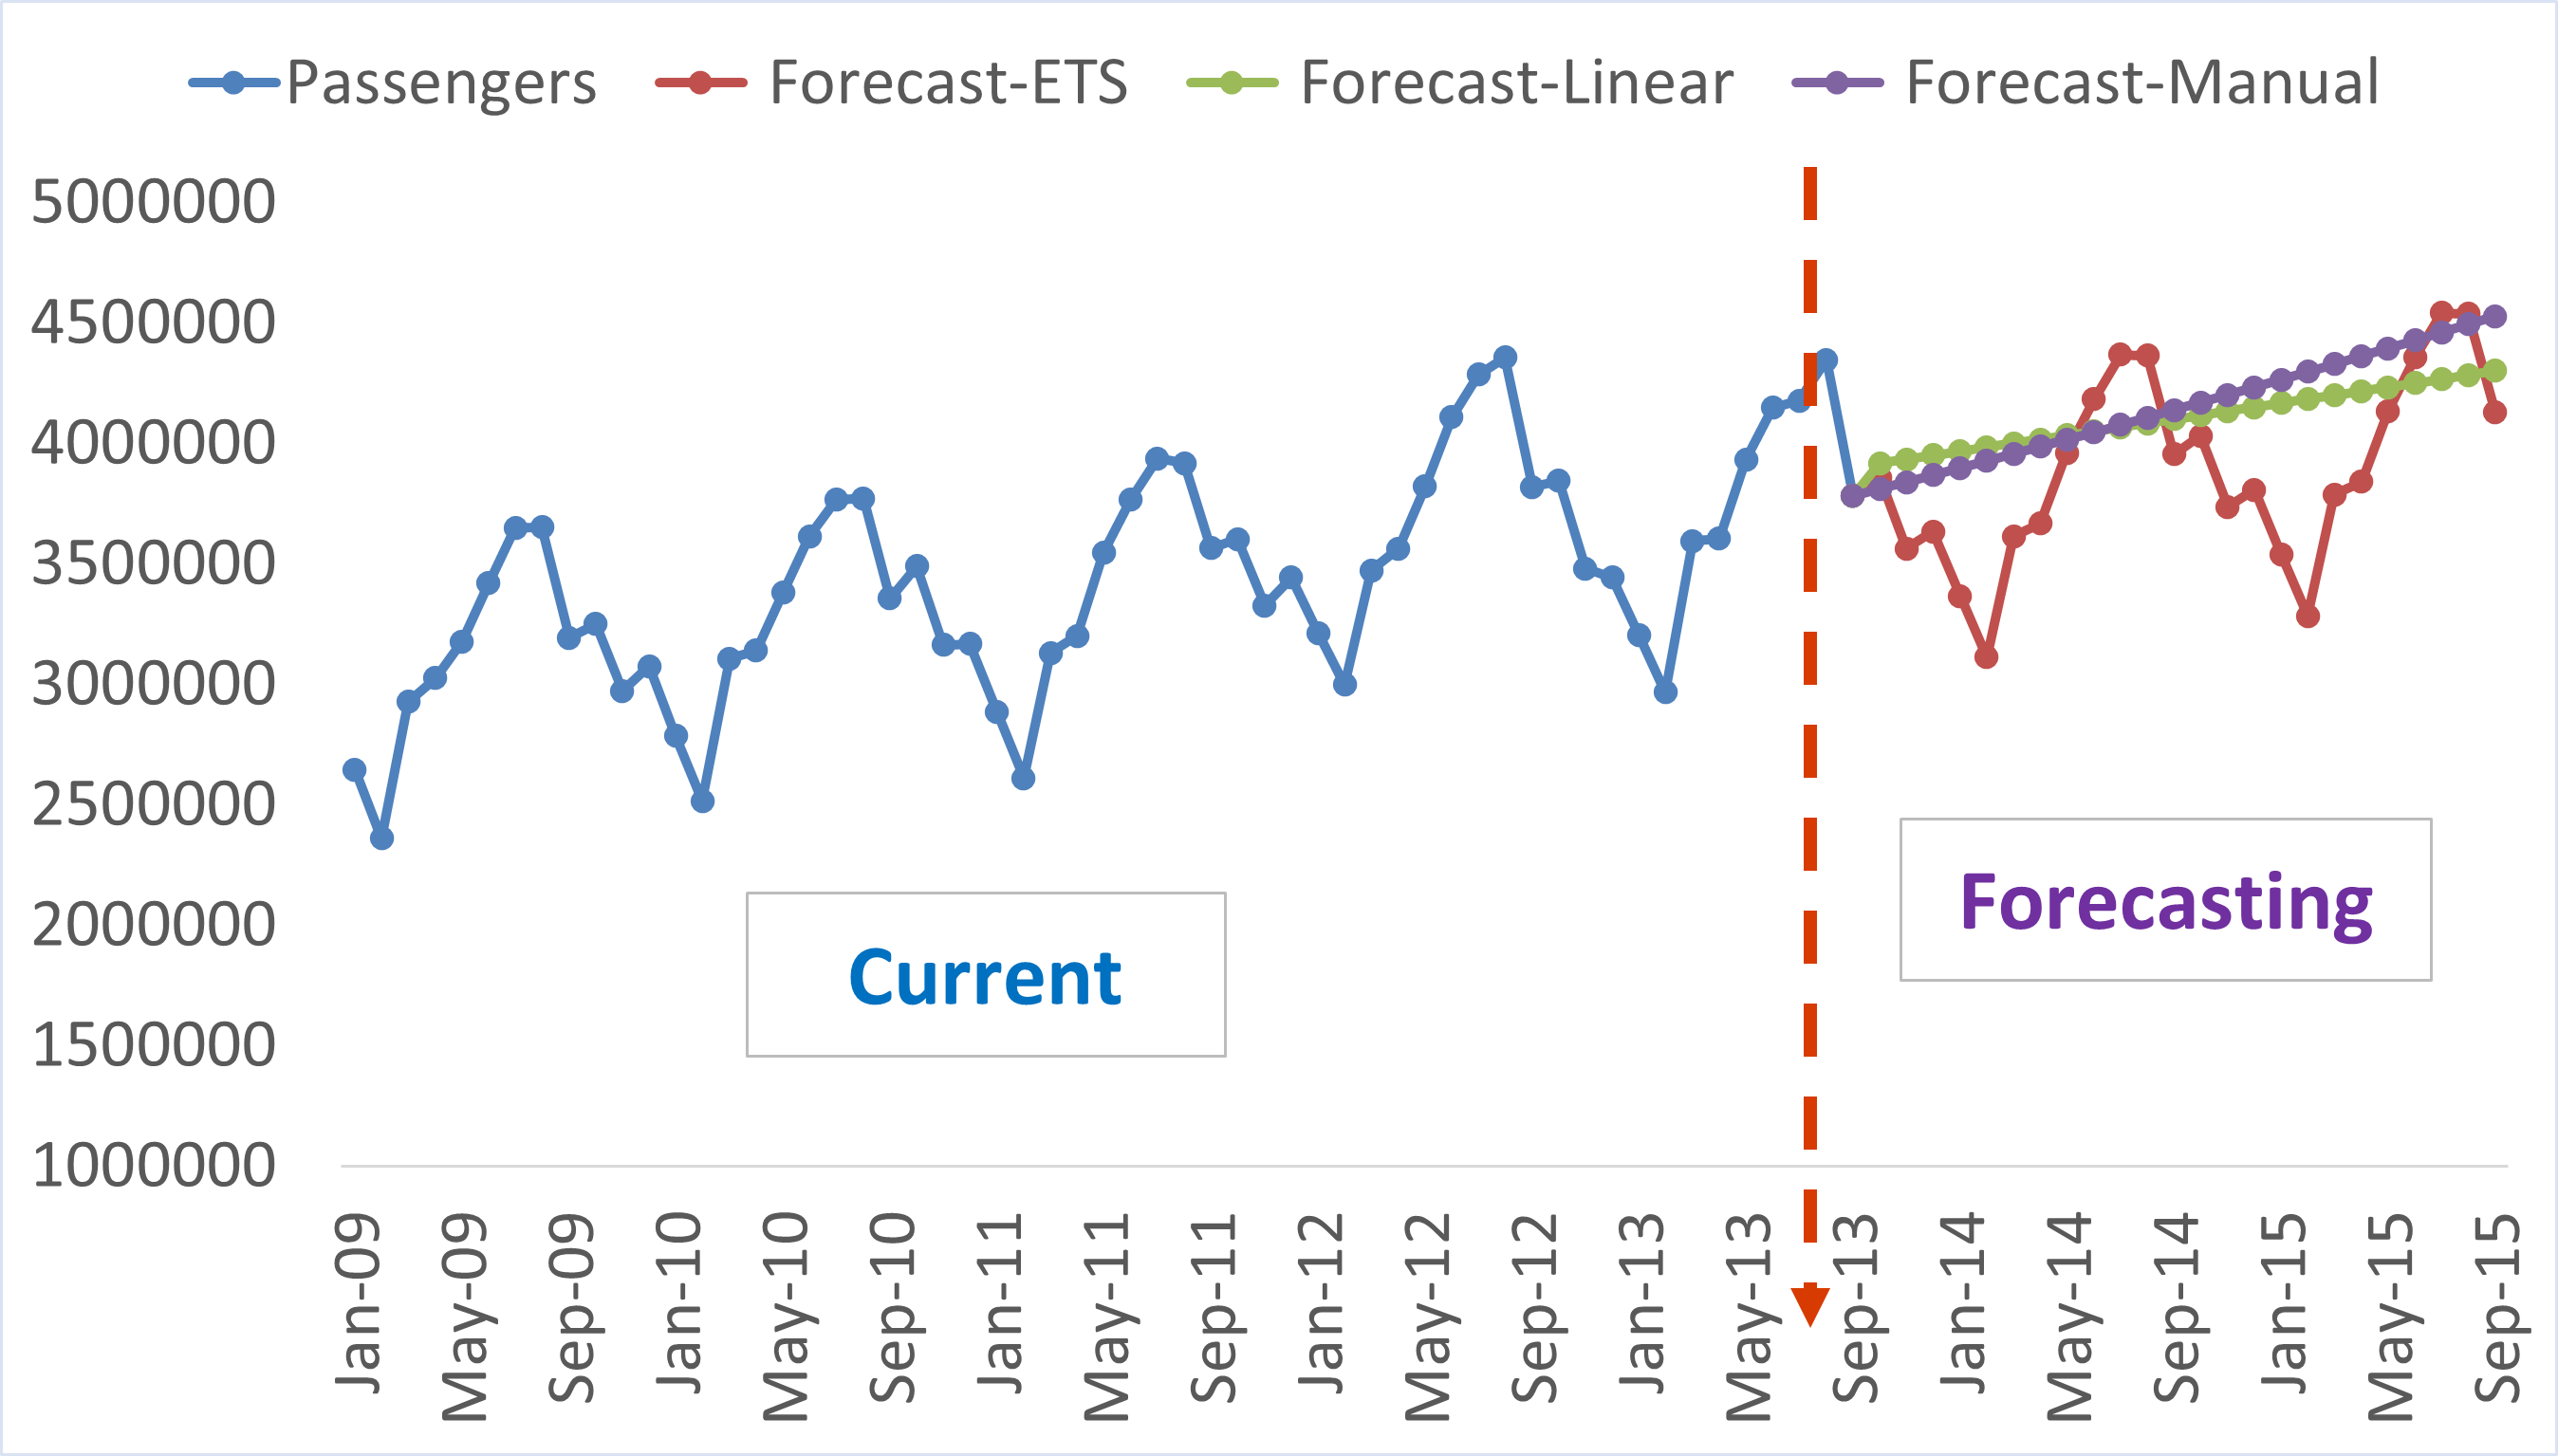
1- FORECAST.LINEAR:
In statistics, linear regression is an approach for modeling the relationship between a dependent variable (y values) and an independent variable (x values). FORECAST.LINEAR uses this approach to calculate a y value for a given x value based on existing x and y values. In other words, for a given value x, FORECAST.LINEAR returns a predicted value based on the linear regression relationship between x values and y values.
The only problem with this module, it doesn't take the seasonality into account.
Example 1: the forecasting looks logical because the historical data follows a linear trend

Example 2: the forecasting looks are inaccurate due to historical data, including many seasonality trends.

2- FORECAST.ETS function (Exponential Smoothing (ETS) algorithm)
Calculates or predicts a future value based on existing (historical) values by using the AAA version of the Exponential Smoothing (ETS) algorithm. The predicted value is a continuation of the historical values in the specified target date, which should be a continuation of the timeline. You can use this function to predict future sales, inventory requirements, or consumer trends.
This function requires the timeline to be organized with a constant step between the different points. For example, that could be a monthly timeline with values on the 1st of every month, a yearly timeline, or a timeline of numerical indices. For this type of timeline, it’s very useful to aggregate raw, detailed data before you apply the forecast, which produces more accurate forecast results as well.
It takes seasonality into account, and it is recommended to be used.

3- Based on the Growth Factor (Linear)
This function is almost the same as the linear Excel formula but it is based on calculating the monthly growth factor( details added in the video below)ethod 2: Direct Forecast Sheet
This method is exactly the same as the Excel function ETS.FORECAST, but it can be created directly through the forecast sheet function in Excel (refer to the below picture and to the video for more details).

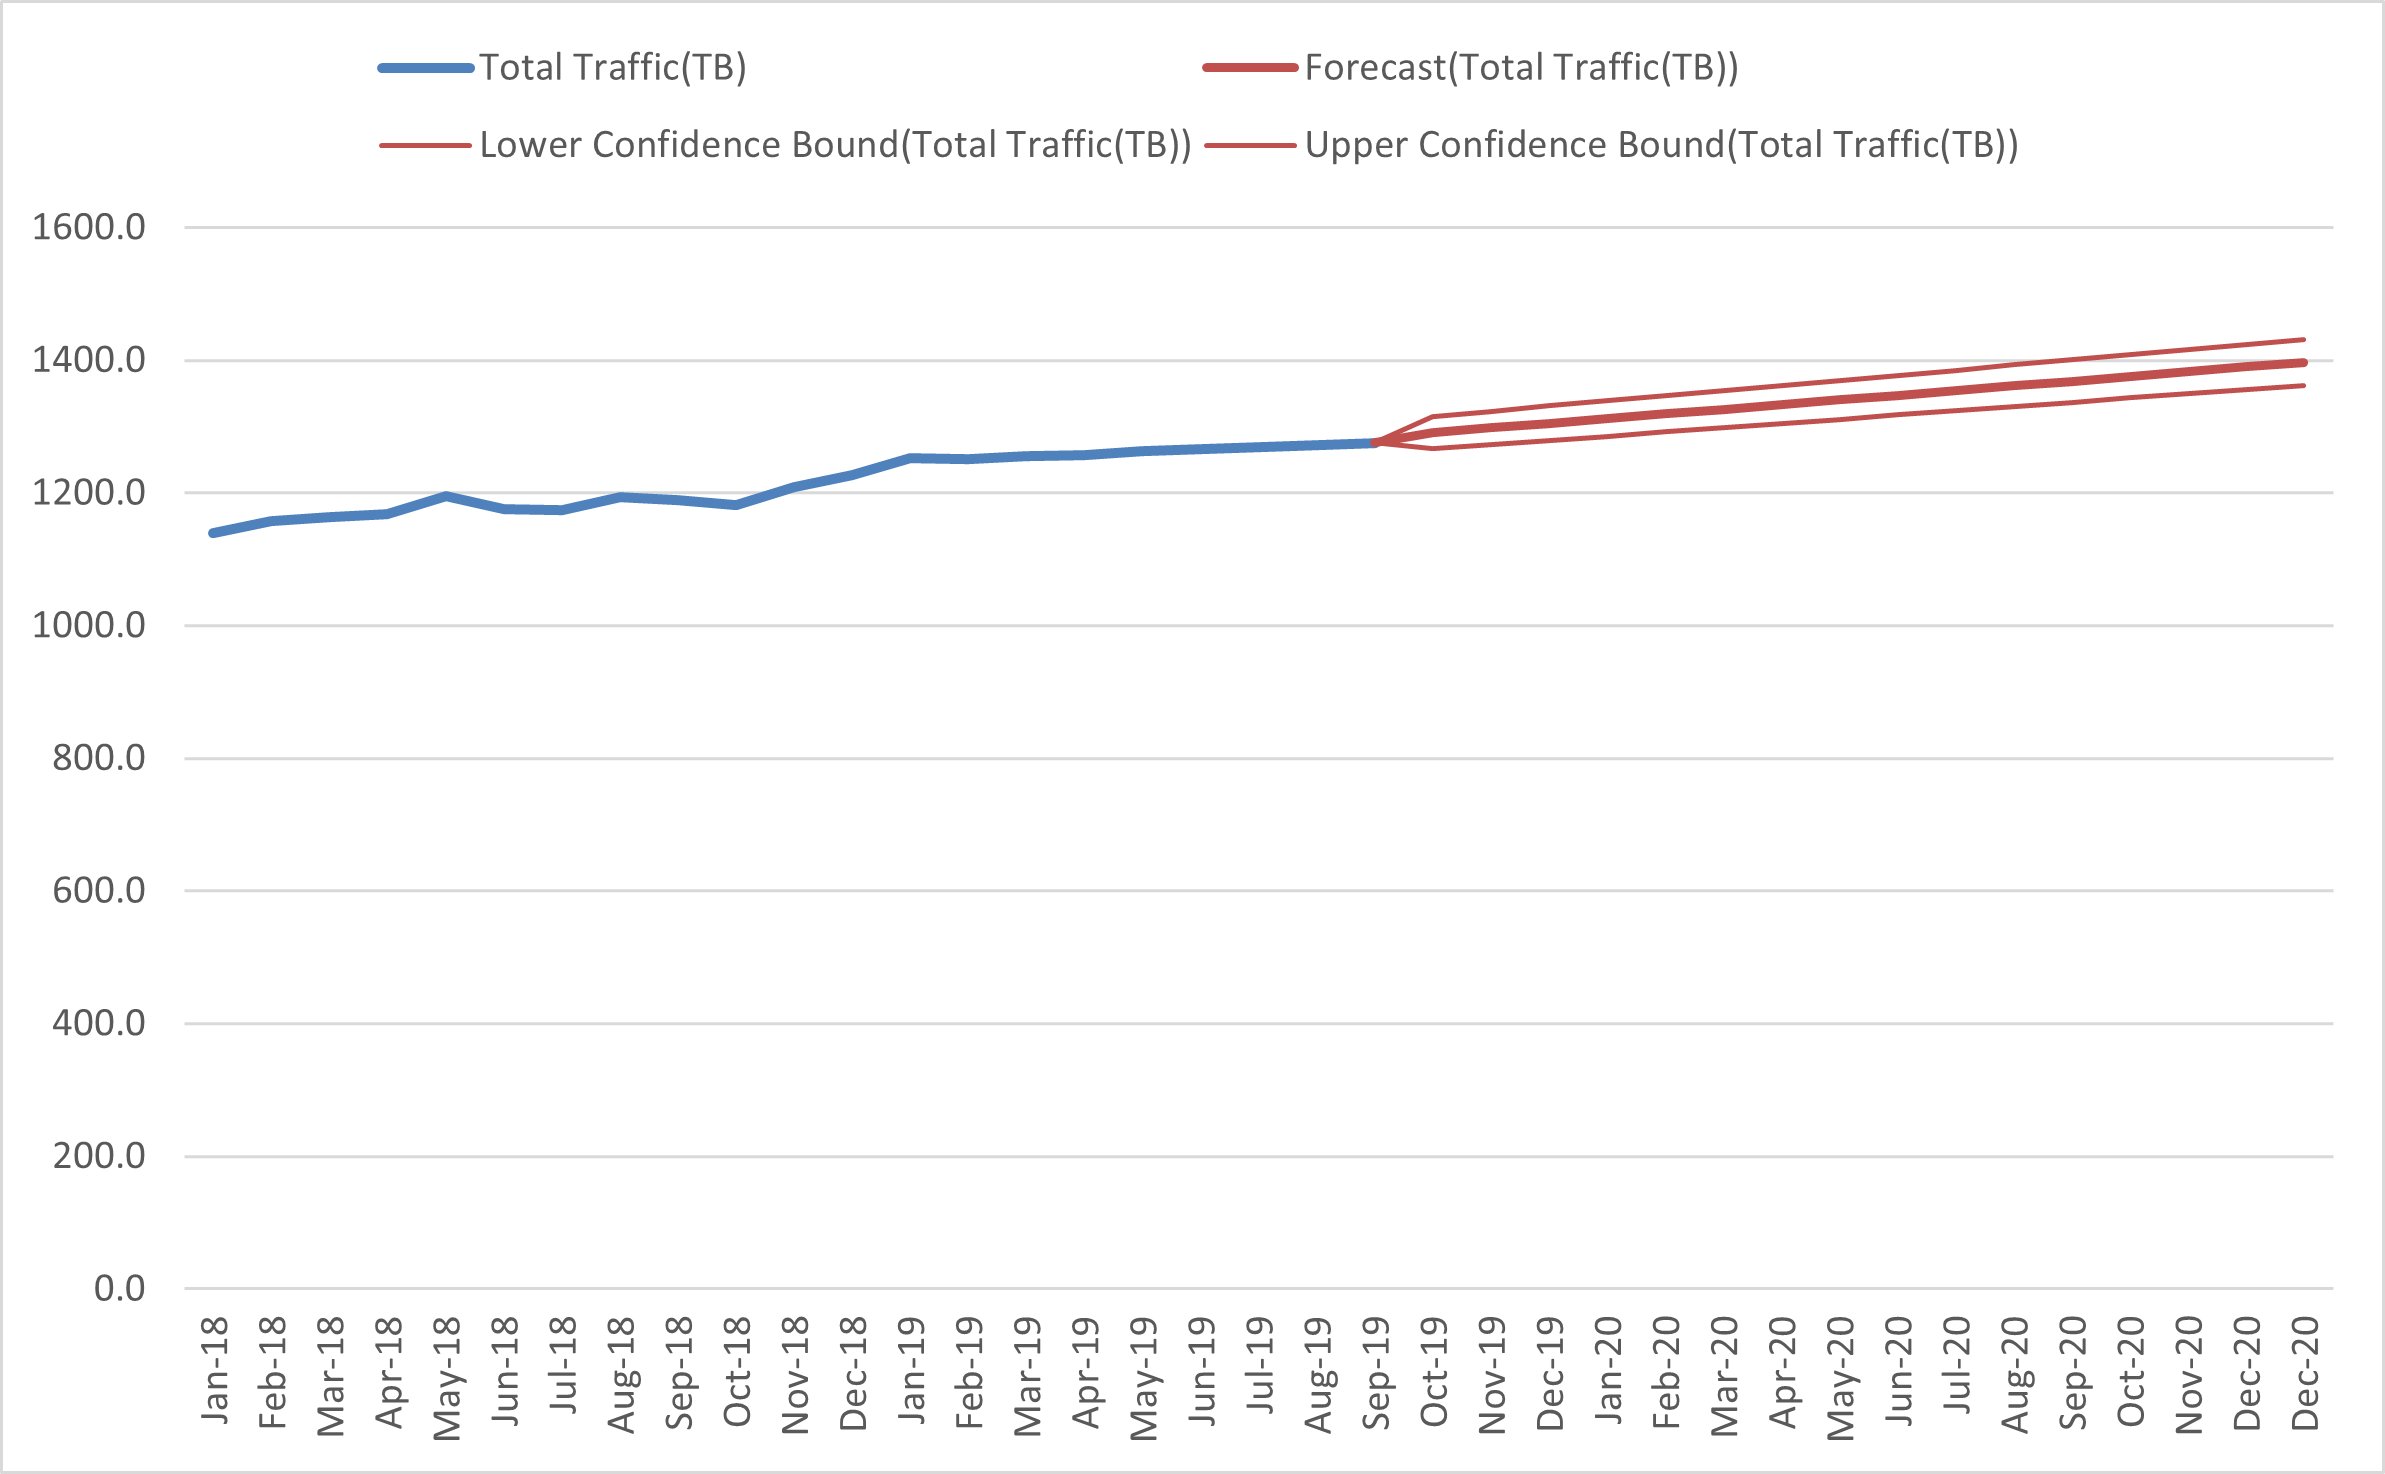
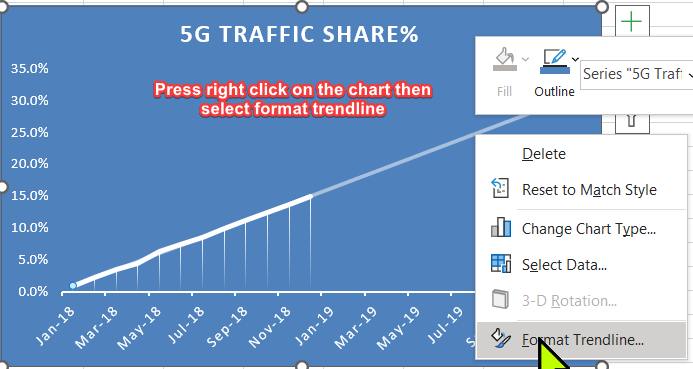
Method 3: Excel Chart Forecasting
Step1:
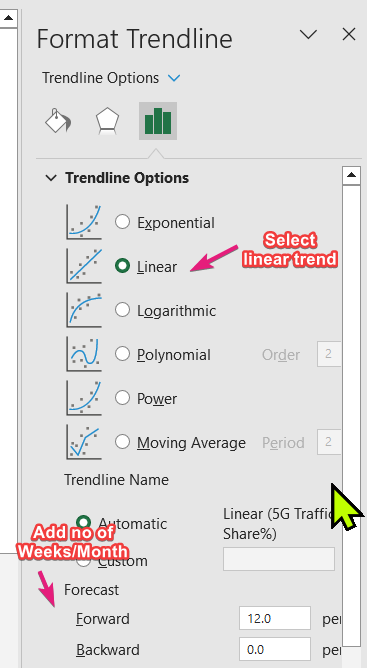
Step2:
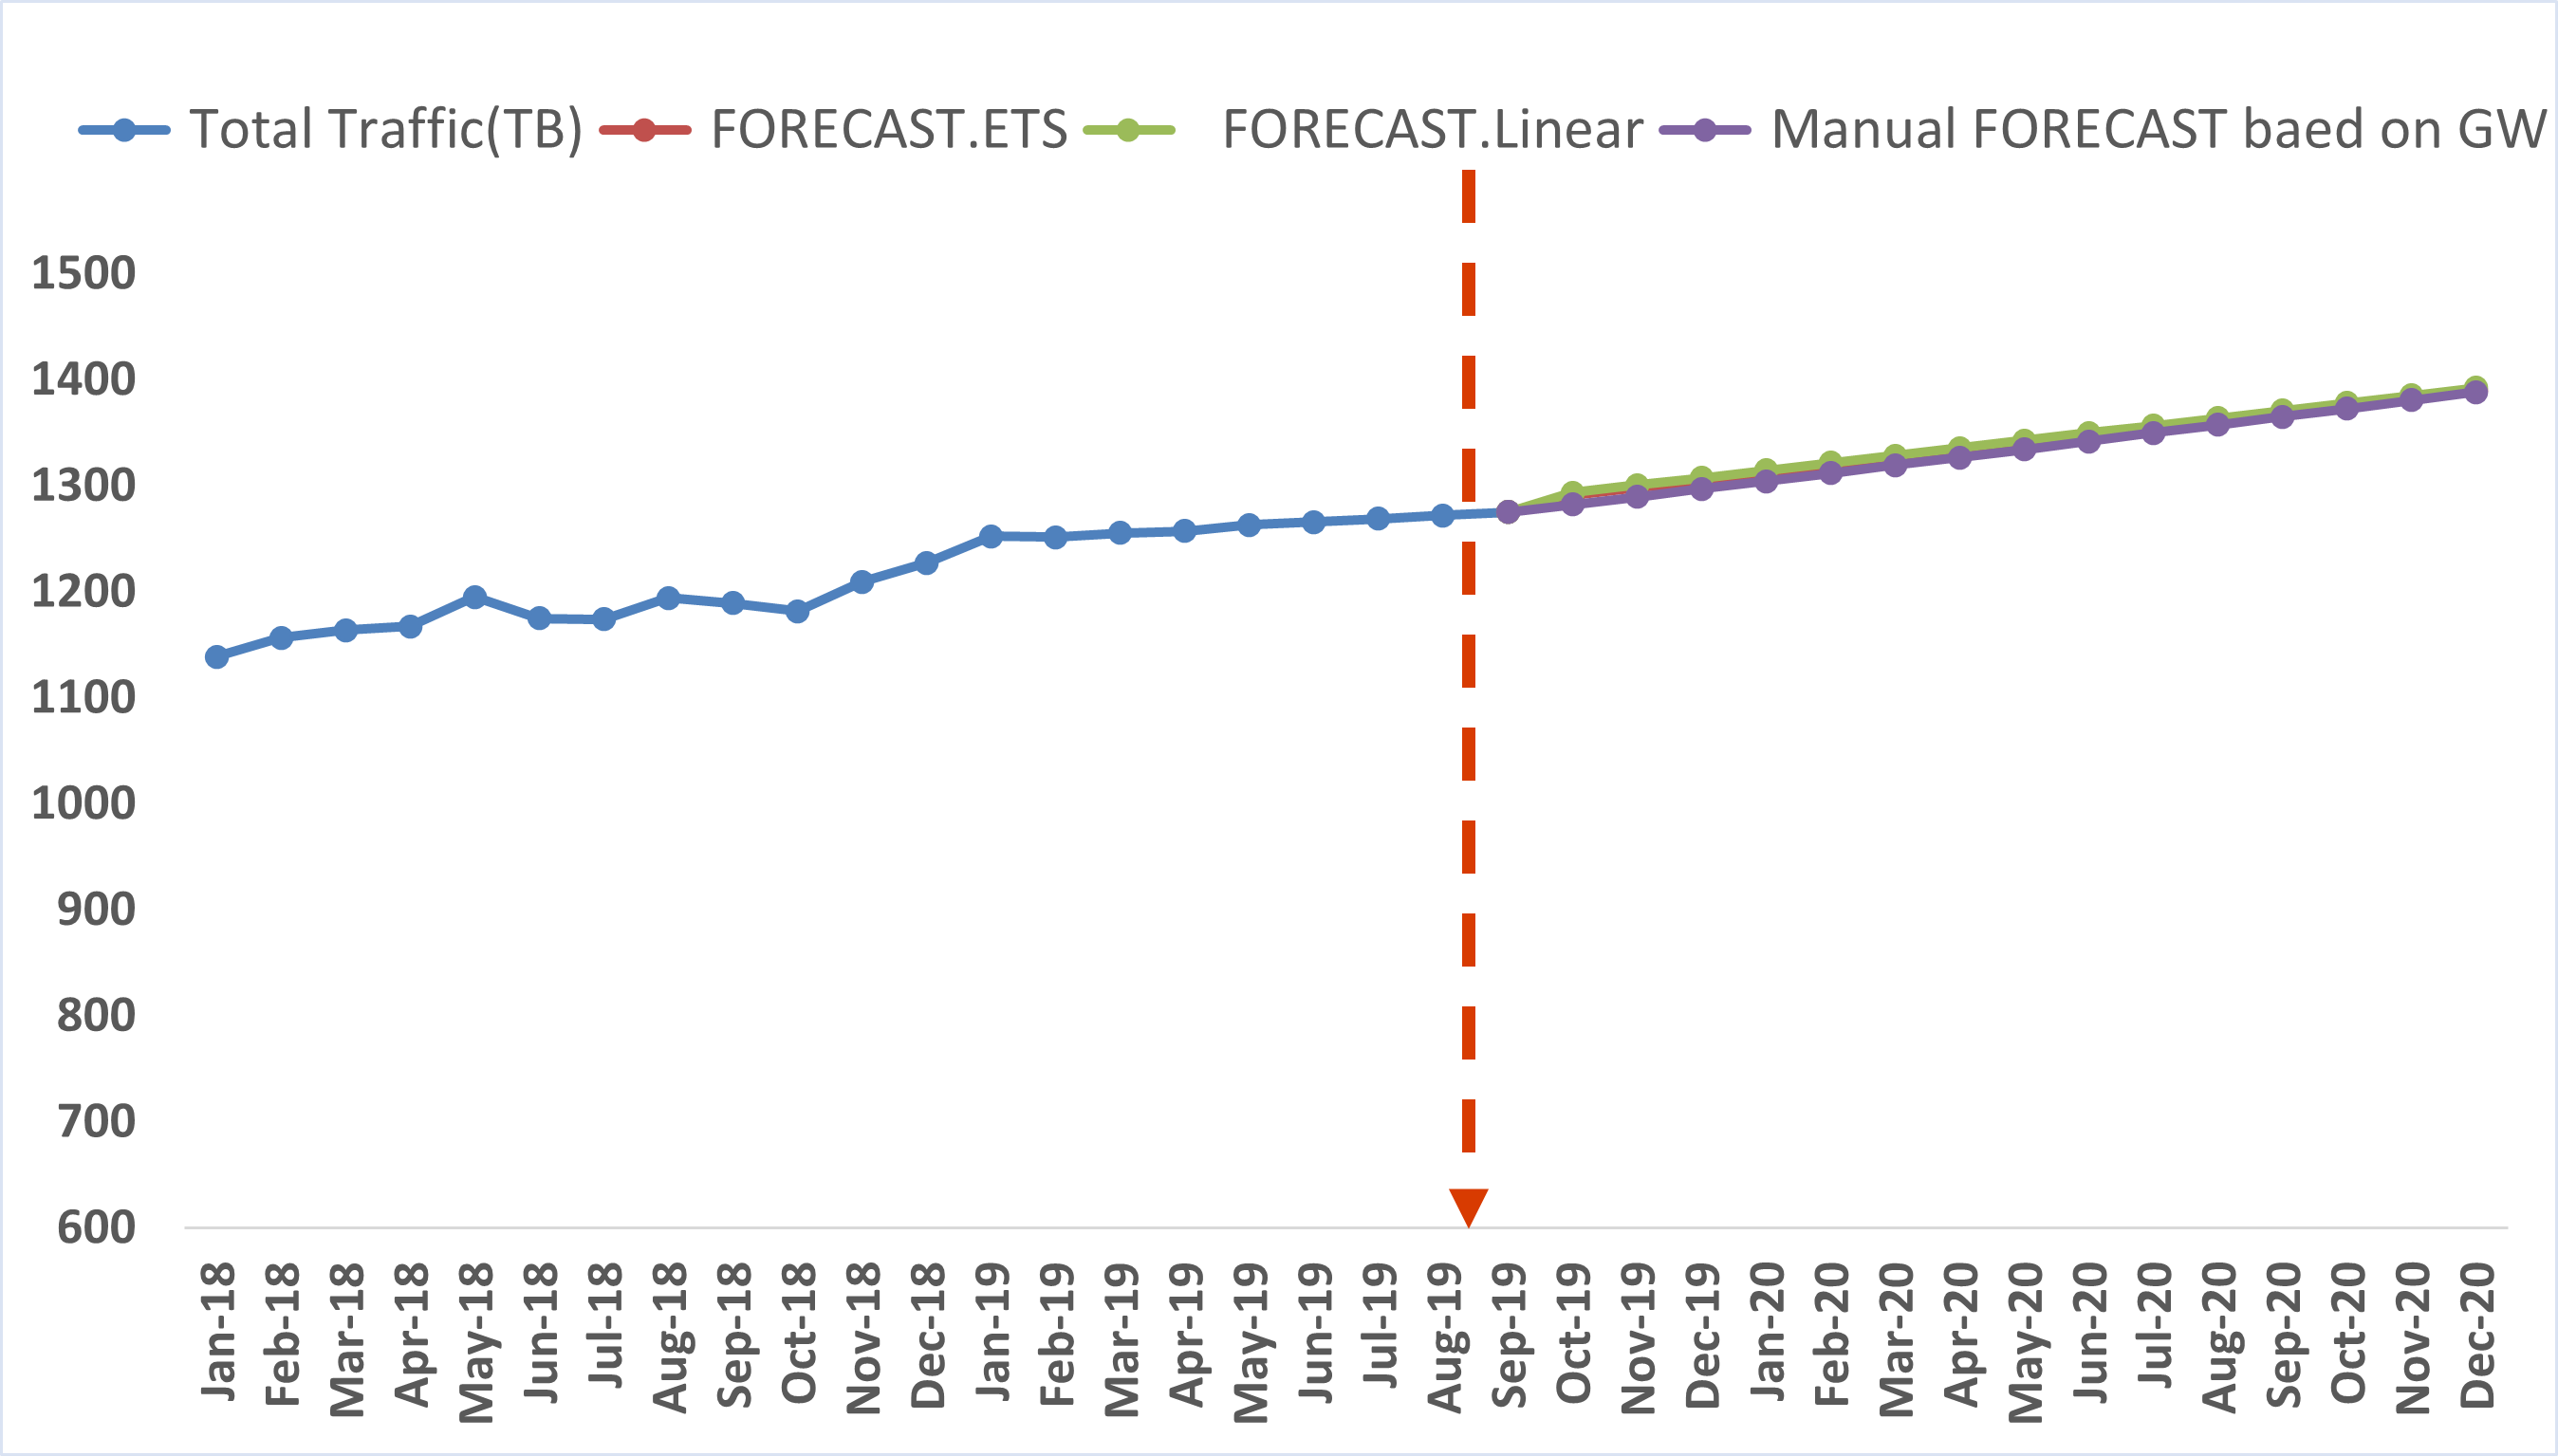
There are no major differences between different forecasting methods in the case the Historical data follow a linear trend.
When There is some seasonality involved in the below trend. Accordingly, a linear trend can`t be used to predict the following year’s data.