Mastering PowerBI: Unleashing Insights from Basics to Pro (Part2/2)

Part 2 of our Power BI series has just dropped! 🚀
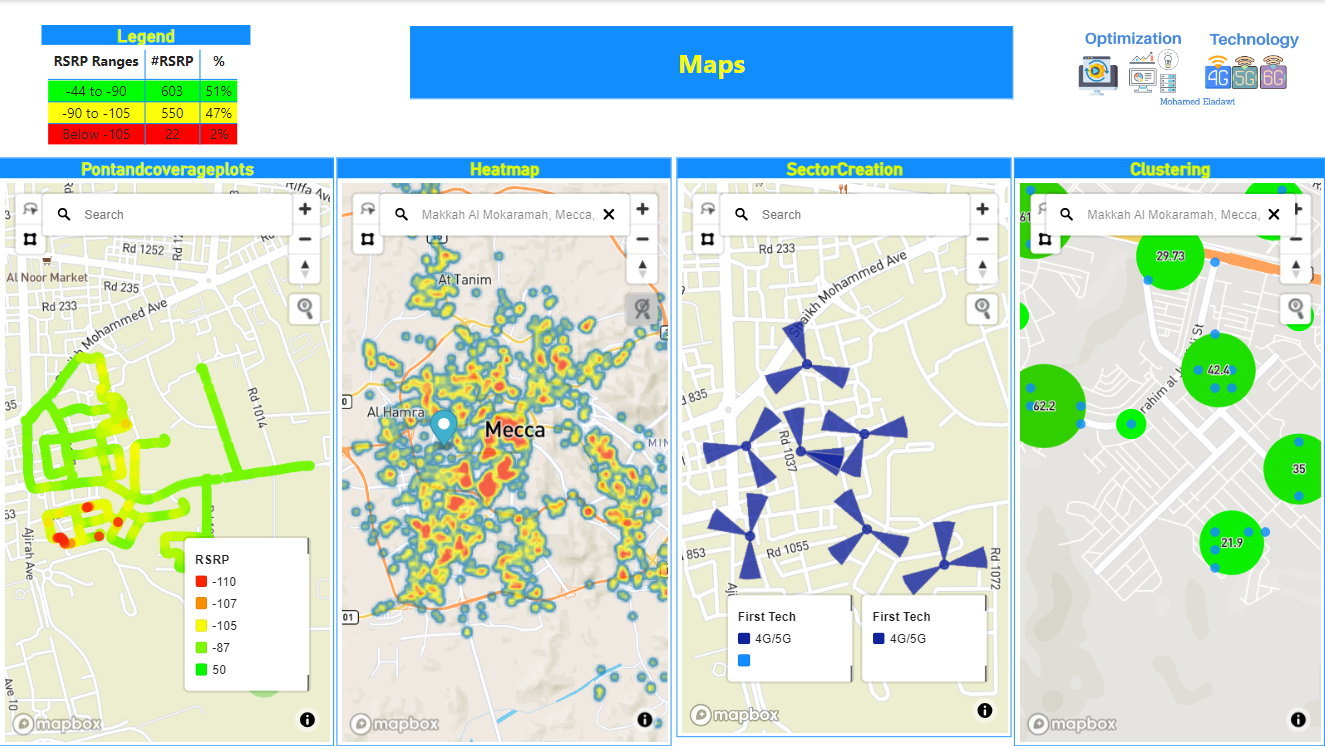
In this installment, we delve into the world of Power BI Maps, conducting a thorough comparison of different mapping options, including ARCGIS, Azure, MapBox, and the standard Power BI Map. Learn how to effortlessly create various map visualizations, from Points/Coverage/RSRP Plots to Custom Legends, HeatMaps, Clustering, Site/Sector Creation, Polygon/Clustering, and even Points Selection and Filtering. Navigate the mapping terrain like a pro!
Part 2 takes a deep dive into DAX Top Use Cases. We demystify essential functions such as Average, AverageX, SUM, SUMX, Count, CountX, RANKX TOPN, IF, SWITCH, TRUE FUNCTION, LOOKUPVALUE FUNCTION, CALCULATE, FILTER, ALLSELECTED, ALL functions, DATEADD, DATESBETWEEN, and DATEDIFF. It's your ultimate guide to mastering DAX!
Data Modeling becomes a breeze as we explore Use Cases and unravel the intricacies of Connection Types, different cardinalities (one-to-one, many-to-one, one-to-many), and cross-filter direction.
Part 3 delivers a detailed practical explanation for most Power Query functions. Unleash the full potential of Power Query.
How to upload sector view to Azure Map?
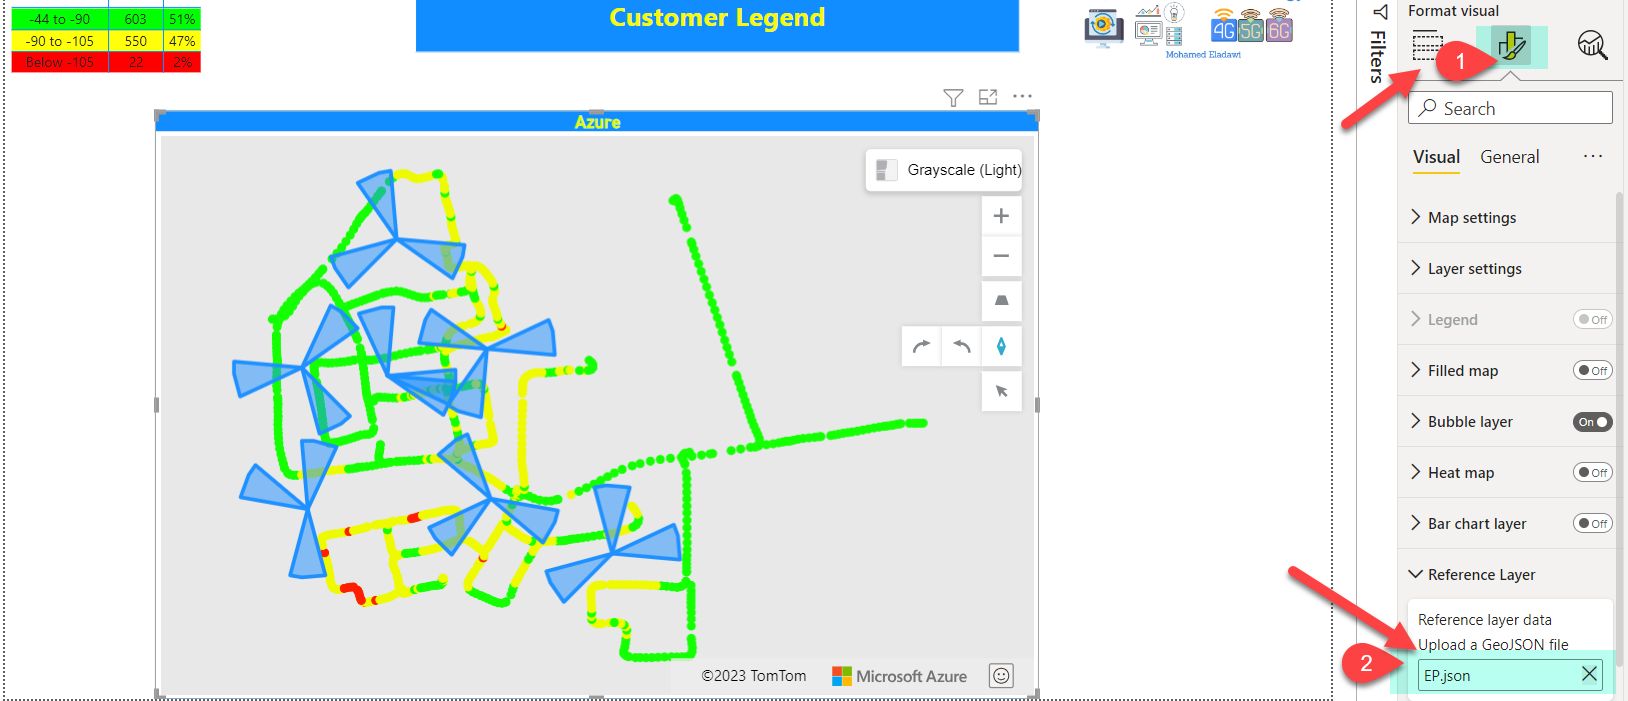
In case the file is not readable, you can convert it to GeoJson format through the below link