Power BI Advanced Visuals: Creating Automated CDF Charts with DAX

Learn how to create and customize a Cumulative Distribution Function (CDF) chart using Power BI DAX.
DAX CDF Formula:
CDF Formula:
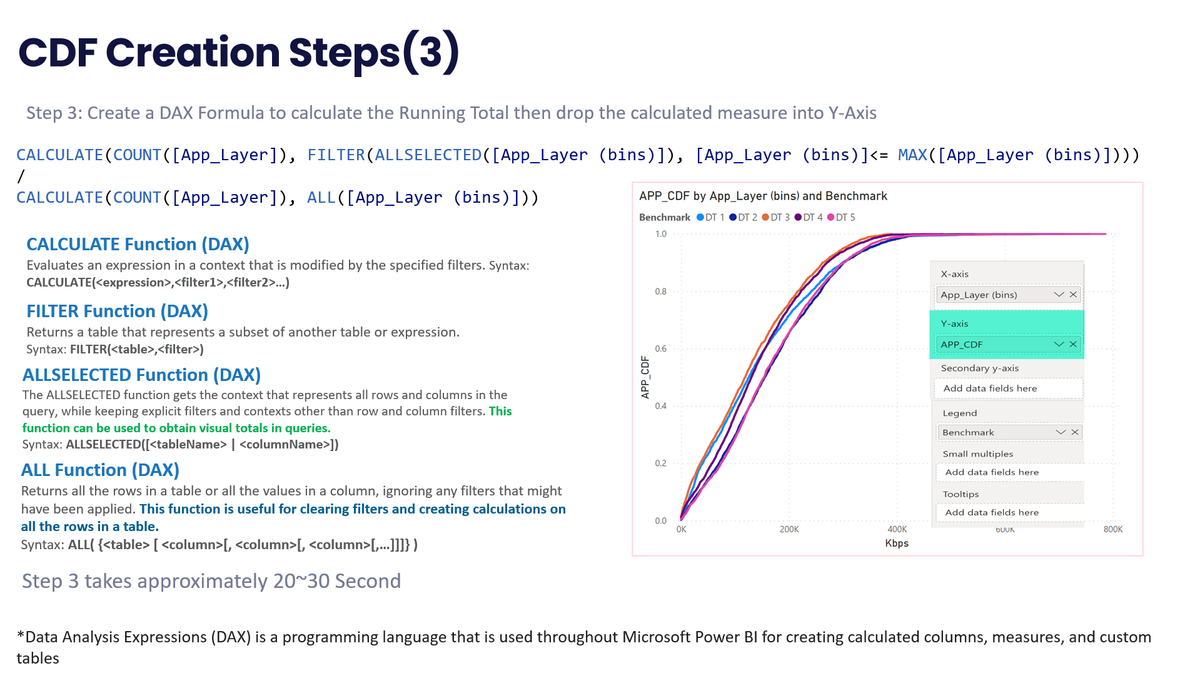
CALCULATE(COUNT([KPI]), FILTER(ALLSELECTED([BINS]), [(BINS)]<= MAX([(BINS)])))
/ CALCULATE(COUNT([KPI]), ALL(BINS]))
CDF Creation Steps
Step 1: Create a Line/Scatter Chart
Step 2: Drag the required Field into the X-Axis. Then create Bins: Example App throughput.
Step 3: Create a DAX Formula to calculate the Running Total then drop the calculated measure into Y-Axis